
DPIC Page: Conditions on Death Row
Includes information such as the length of time prisoners spend on death row
DPIC Page: Racial Demographics
Racial demographics of death-row prisoners
DPIC Report: The 2% Death Penalty
How a Minority of Counties Produce Most Death Cases at Enormous Costs to All
DPIC Page: Sentencing Data
Information on new death sentences
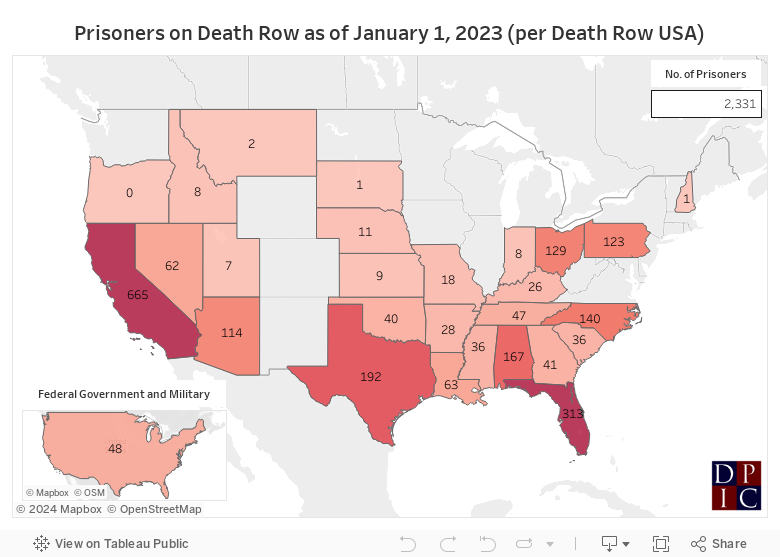
Death Row Prisoners by State
Total Number of Death-Row Prisoners* as of January 1, 2023: 2,331**
| State | Number of Prisoners |
|---|---|
| California | 665 |
| Florida | 313 |
| Texas | 192 |
| Alabama | 167 |
| North Carolina | 140 |
| Ohio | 129 |
| Pennsylvania | 123 |
| Arizona | 114 |
| Louisiana | 63 |
| Nevada | 62 |
| Tennessee | 47 |
| U.S. Fed. Gov't. | 44 |
| Oklahoma | 40 |
| Georgia | 41 |
| Mississippi | 36 |
| South Carolina | 36 |
| Arkansas | 28 |
| Kentucky | 26 |
| Missouri | 18 |
| Nebraska | 11 |
| Kansas | 9 |
| Idaho | 8 |
| Indiana | 8 |
| Utah | 7 |
| U.S. Military | 4 |
| Montana | 2 |
| New Hampshire | 1 |
| South Dakota | 1 |
| Oregon | 0 |
| Wyoming | 0 |
Source: Death Row Population Figures from NAACP Legal Defense and Educational Fund, Inc. “DEATH ROW USA” (As of January 1, 2023).
* Figures include persons whose death sentences have been overturned but who still face the possibility of being re-sentenced to death after a new trial or new sentencing hearing. The number of prisoners in the U.S. facing active death sentences is lower.
** The state-by-state total of individuals on death row is greater than the national total because four prisoners are sentenced to death in two different states.
“I miss the stars. You know, I haven’t seen the stars in years and years and years. I miss the rain. I miss food. I miss all these things. But what it comes down to the most — and this is the thing that will scar me the most and that I’ll carry with me as a scar the longest — the thing I miss the most is being treated like a human being.”
—CNN interview with Damien Echols on Arkansas death row since 1993
(Jan. 13, 2011) (released August 2011).
News & Developments
News
Sep 12, 2021
Report: After 20 Years of Decline, Spring 2021 Death-Row Population Matches Level in 1991

The number of people on death row or facing possible capital resentencing across the United States now matches a three-decade low, according to data compiled by the NAACP Legal Defense and Educational Fund (LDF) and analyzed by the Death Penalty Information Center.
Read MoreNews
May 22, 2023
Death Row USA Summer 2022 Report: Death-Row Population Continues Long-Term Decline
The number of people sentenced to death or facing the possibility of a death sentence in pending capital retrial or resentencing proceedings continued its more than two-decade decline in the third quarter of last year, according to the NAACP Legal Defense and Educational Fund (LDF) Summer 2022 quarterly census of death rows across the United States.
Read MoreNews
Sep 02, 2022
Spring 2022 Death Row USA: 11 State Death Rows Decrease in Size as Nationwide Erosion of Capital Punishment Continues in First Quarter of 2022
The nationwide erosion of the death penalty in the United States continued in the quarter of 2022, as the death rows of eleven states decreased in size and no state or federal death row grew larger, according to the Legal Defense Fund’s Spring 2022 Death Row USA (DRUSA) report on capital punishment.
Read MoreNews
Mar 14, 2022
Winter 2022 Death Row USA: State Death Rows Drop Below 2,400 For First Time Since 1990
The number of people sentenced to death or facing continuing jeopardy of execution in pending capital retrial or resentencing proceedings in U.S. states has dropped below 2,400 for the first time since 1990, a Death Penalty Information Center analysis of NAACP Legal Defense and Educational Fund (LDF) data has shown.
Read More
News
Feb 09, 2022
Death Row USA Fall 2021 Report: Death-Row Population Continues Long-Term Decline
The number of people sentenced to death or facing continuing jeopardy of execution in pending capital retrial or resentencing proceedings continued its more than two-decade decline in the third quarter of 2021, according to the NAACP Legal Defense and Educational Fund (LDF) Fall 2021 quarterly census of death rows across the United States.
Read More
News
Dec 29, 2021
Death Row USA Summer 2021 Report: Fewest Death-Sentenced Prisoners in Three Decades Face Continuing Jeopardy of Execution
Fewer people were on death rows across the United States as of July 1, 2021 or faced continuing jeopardy of execution in pending capital retrial or resentencing proceedings than at any other time in more than three decades, according to data compiled by the NAACP Legal Defense and Educational Fund (LDF) and analyzed by the Death Penalty Information Center.
Read More
News
Dec 10, 2021
Bureau of Justice Statistics: Death Row Below 2,500 First Time in 29 Years After 20 Consecutive Years of Decline, Average Time on Death Row Reaches 19.4 Years
The number of people under sentence of death in the United States has fallen below 2,500 for the first time in 29 years following twenty consecutive years of decline, according to the U.S. Department of Justice Bureau of Justice Statistics (BJS).
Read More
News
Sep 01, 2021
NAACP Legal Defense Fund: U.S. Death Row Falls to Lowest Level in Nearly Three Decades
The number of people on death row or facing possible capital resentencing in the United States has fallen to its lowest level in nearly three decades, according to a DPIC analysis of the latest death-row data compiled by the NAACP Legal Defense and Educational Fund (LDF).
Read More
News
Jun 25, 2021
Bureau of Justice Statistics Reports Number on Death Row Down, Average Time on Death Row Approaches 19 Years
The number of prisoners on death row across the United States continues to decline while the average amount of time they have been on death row approaches 19 years, according to a new report from the Department of Justice Bureau of Justice Statistics (BJS).
Read More
News
Oct 05, 2020
Bureau of Justice Statistics, NAACP Legal Defense Fund Reports Document Ongoing Decline of U.S. Death-Row Population
The Department of Justice Bureau of Justice Statistics (BJS) and the NAACP Legal Defense and Educational Fund, Inc. (LDF) have issued new reports documenting the continuing historic decline of the death penalty across the United States.
Read More
News
Aug 11, 2020
Spring 2020 Death Row Report Documents Continuing Erosion of Death Row
The slow but steady erosion of U.S. death row continued in the first quarter of 2020, data from the latest quarterly death-row census by the NAACP Legal Defense and Educational Fund (LDF) has revealed. The Spring 2020 edition of Death Row USA (DRUSA), released August 10, reports that 2,603 people were on death row or facing resentencing as of April 1, 2020. That marked a decline of 17 since the January 1, 2020 report and a 2.6% drop from the 2,673 LDF reported for April 1, 2019.
Read More