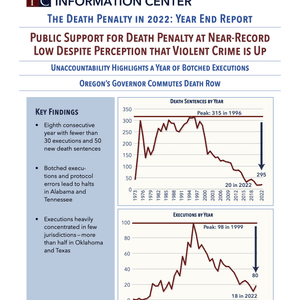
Introduction
In recent years, states that have abolished the death penalty have also had populations with a high percentage of Catholics (Illinois 30%; New Jersey 41%; New Mexico 25 %; and New York 37%). In some instances, Catholic political leaders, such as Gov. Pat Quinn in Illinois and Gov. Bill Richardson in New Mexico, played a prominent role in decision making on the death penalty. Although many factors play a role in legislative actions, a recent poll by Lake Research Partners on behalf of the Death Penalty Information Center indicated that Catholics were more disturbed about the problems of capital punishment and more supportive of alternative sentences than the general population.
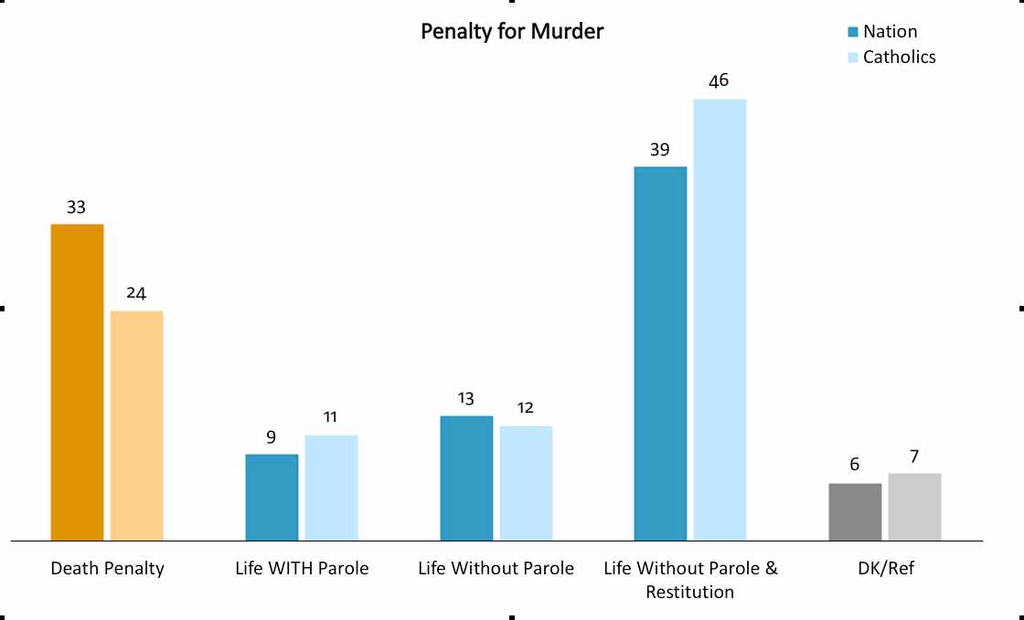
1. Only 24% of Catholics—compared to 33% of the general population—supported the death penalty when respondents were given a range of alternative punishments for murder. Fifty-eight percent (58%) supported some form of a life without parole sentence for such offenders.
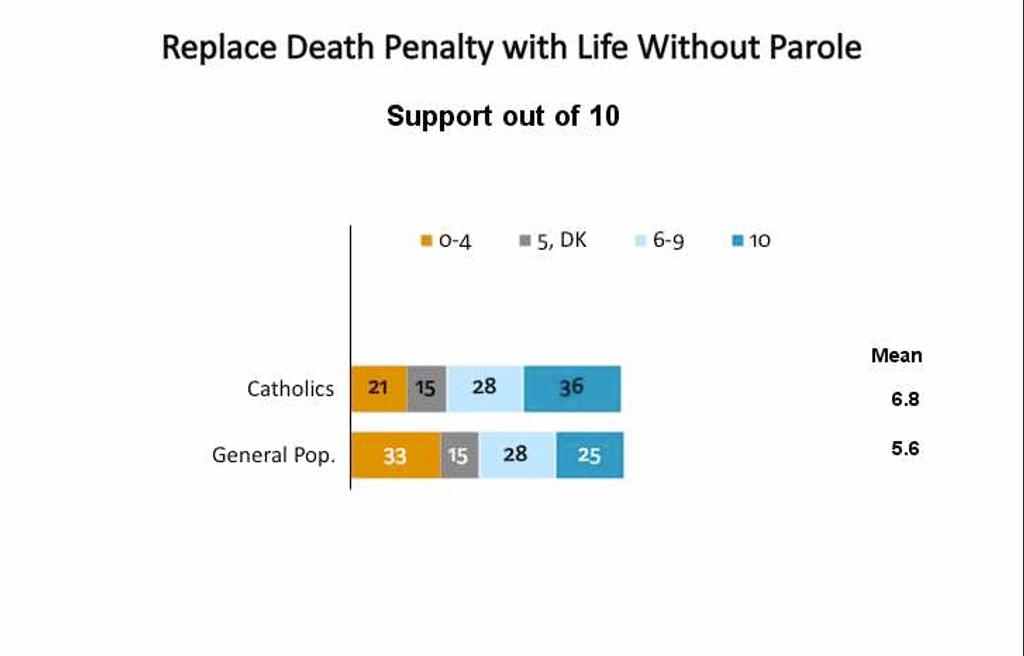
2. On a scale of 1-10, Catholics supported replacing the death penalty with life without parole by an average score of 6.8, compared to 5.6 nationally. Only 21% of Catholics were not supportive of this change (i.e., rated it 0-4).
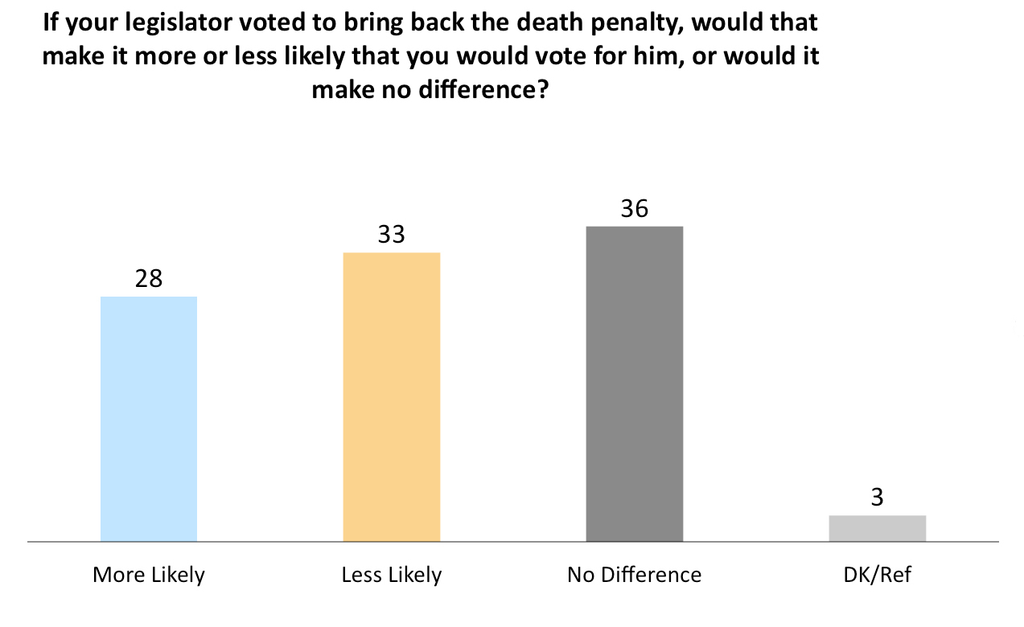
3. Thirty-three percent (33%) of Catholics would be less likely to support legislators who voted to bring back the death penalty, while only 28% would be more likely to support such a legislator. For both Catholics and the population at large, however, the most common response was that such a vote would make no difference in their support (Catholics: 36%; Nation: 43%).
4. One of the reasons for Catholics’ discomfort with the death penalty was their moral beliefs. On a scale of 1-10, Catholics rated the statement “The death penalty is against my moral beliefs” at 5.9, compared to the national average of 4.7.
5. Practical problems with the death penalty also loomed large for Catholic respondents. Catholics largely agreed with the statement: “The death penalty is a wasteful big government program because it costs a lot of money and it is not effective.” (5.6 agreement/10).
6. The message that reverberated most strongly with Catholics was about the unfairness of the death penalty. Eighty-one percent (81%)—compared to 69% nationally—found the following statement convincing:
Our criminal justice system should treat all people equally, regardless of how much money they make, where they live, or the color of their skin. In reality, the death penalty is applied unevenly and unfairly, even for similar crimes. Some people are sentenced to die because they couldn’t afford a better lawyer, or because they live in a county that seeks the death penalty a lot. A system that is so arbitrary should not be allowed to choose who lives and who dies.
7. In terms of their politics, Catholics rated themselves as mostly moderate (36%) or conservative (36%), while a quarter identified themselves as liberal (25%).
DPIC is a non-sectarian, non-profit organization. For the complete poll results of Catholic and non-Catholic respondents, see Catholics.pdf. For more information on the general poll results, see www.deathpenaltyinfo.org/pollresults.
The nationwide poll of 1,500 registered voters was conducted by Lake Research Partners in May, 2010. The number of Catholic respondents was 347, or 24% of those surveyed, approximately equal to the percent of Catholics in the general population.
###
Public Opinion
Mar 11, 2024
OP-ED: Journalist Recalls Witnessing an Execution and Describes the Importance of Media Witnesses
Public Opinion
Jul 26, 2023